Sent to you by nigel via Google Reader:
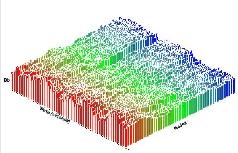
So, you're living in Florida, and you just suffered through a massive blackout. Want advance warning of the next one? Then go to the website of the Pacific Northwest National Laboratory, and download the "Grid Monitor" -- a screensaver that shows you the stability of the power grid, in real time, via a series of totally gnarly graphics, such as the Oscillatory Mode Graph above.
You can actually watch the grid begin to buckle and collapse when a blackout is approaching. Since grid collapses occur randomly and very infrequently, you'd have to be staring at your screensaver 24 hours a day, but hey: Maybe you'll get lucky! On the other hand, you can also set the screensaver to give off a warning sound when the power in the grid fluctuates too wildly -- an impending sign of a blackout.
Pacific Northwest also created this nice PDF pamphlet that explains how the Grid Monitor works. It contains this rather metaphorically lovely passage:
In reality, the AC electric power signal is the sum of innumerable sub-signals. The 60 Hz AC signal is actually a complex accumulation of many elements such as random noise, mechanical vibratory dynamics of generators producing the power, damping effects, and even self-induced oscillatory dynamics of the transmission grid. It acts like a tremendous bed of interconnected springs and weights.
Things you can do from here:
- Subscribe to collision detection using Google Reader
- Get started using Google Reader to easily keep up with all your favorite sites
No comments:
Post a Comment