Sent to you by nigel via Google Reader:
I had some great stuff sent into me on the heels of this post earlier in the week on the man games lost to injury totals, including this chart from Kyle Joecken, a graduate student in mathematics at The Ohio State University:
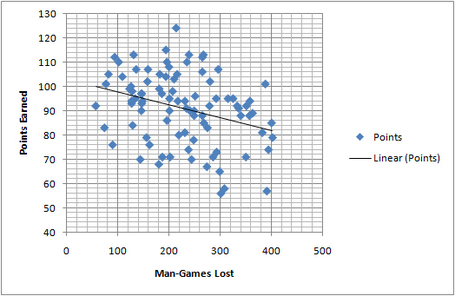
Essentially what this shows is the performance of teams and their injury totals from 2005-06 to 2007-08 (he did not include this season's projections). On average, teams during this period that had 100 man games lost to injury finished with about 10 more points than those that had 300.
And it's been virtually impossible to have a great season with more than 300 man games lost to injury. (This season's Capitals team will likely be only the second to top 100 points postlockout.)
Here's some geek speak from Kyle on this: "The equation for the line was y = -.0528x + 103.19. The R^2 value is .1018."
His conclusion based on this data (and ignoring the fact that some injuries are much, much more devastating than others)?
"Basically, you lose one point for every 20 man-games lost."
Of course, that's all depending on averages, etc., and the correlation isn't that high, but if you apply that conclusion to a team rocked by injuries like the Islanders (on pace for an insane 566 man games lost to injury), they'd finish the season with about 28 more points than they're on pace for.
Or right about eighth or ninth in the Eastern Conference.
Things you can do from here:
- Subscribe to From The Rink using Google Reader
- Get started using Google Reader to easily keep up with all your favorite sites
No comments:
Post a Comment